DCRS sea ice visualisation system
User's guide
|
|
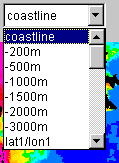
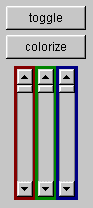
Vector graphicsA number of vector graphics overlays may be available, and can be selected from the vector graphics selection box that appears when you hit the 'coastline' button. When you have selected a vector dataset (one item) you must click the 'toggle' button on the right side of the screen to draw the graphics. Graphics are initially drawn using a predefined colour, but you can change the colour of any graphics layer by selecting the graphics from the vector graphics selection box, mixing the desired amount of red, green and blue using the scroll bars and pressing the 'colorize' button. For a further description of the individual vector datafiles select the button belov
|